Mario Miranda Sazo, Yu Jiang, Mariela Curreti, Luis Gonzalez and Terence Robinson
Reprinted (with permission) from Fruit Notes, Volume 26, Issue 3, June 23, 2026. Cornell Cooperative Extension, Lake Ontario Fruit Program.
https://rvpadmin.cce.cornell.edu/pdf/lof_newsletter/pdf428_pdf.pdf
Early this year one of our presentations delivered on the Precision Crop Management of Apples project funded by USDA through the SCRI program, focused on variable rate spraying technology. We explained how the system uses camera mapping and geo-referenced data to categorize trees by blossom density into high, medium, and low categories, then it applies different chemical doses based on these classifications. The presentation detailed successful testing with drone and ground-based camera systems at Geneva, as well as computer-controlled sprayers from companies like Hol Spraying Systems (HSS, from the Netherlands) and Munckhof (also from the Netherlands). We highlighted that while individual tree spraying presented challenges due to physics and GPS accuracy, the two successful approaches involved mapping individual trees or mapping 30-foot sections and dividing each section into 3-foot segments. In 2025 variable rate spraying research with Golden Delicious at Cornell AgriTech demonstrated that variable rate spraying could significantly impact profitability, potentially adding $6,600 per acre through thinning high blooming trees with a full dose but thinning low blooming trees with a low dose to allow more doubles on spurs.
Variable rate spraying technology aims to apply different chemical treatments and doses to trees based on their flower density. The system uses camera mapping to create a task map, which controls a computerized sprayer ‘smart sprayer’ to apply varying amounts of chemicals based on blossom load. This new technological approach with the use of smart sprayers can apply chemical thinners VARIABLY across an orchard and allow growers to spray chemical thinners on trees with high crop load DIFFERENTLY than trees with low crop load in the same row or orchard block.
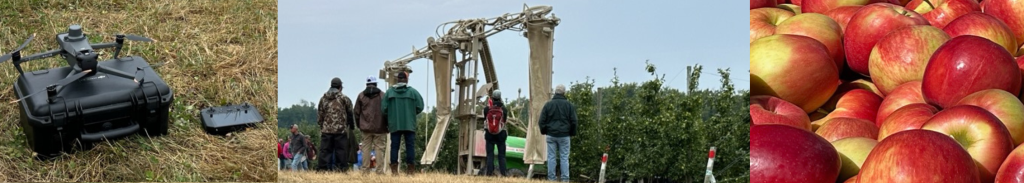
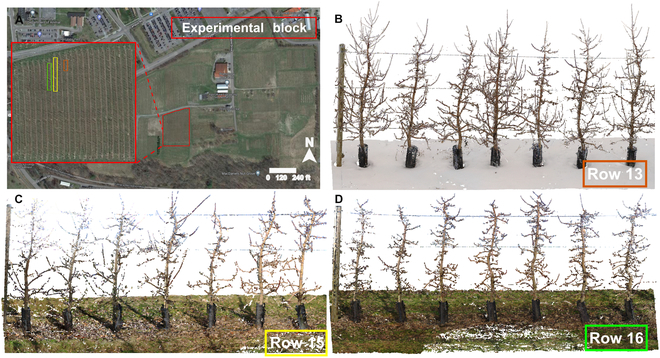
This 2026 growing season we organized 3 research trials on growers farms by collaborating with three Western New York apple growers, each of whom selected a mature Honeycrisp block exhibiting substantial variability in bloom density at the early bloom stage. Two imaging systems were used to scan the orchards and generate prescription or task maps: OUTFIELD, a drone-based imaging platform developed in England scanned the block at Lamont Fruit Farm, and AUREA Imaging, a ground-based vision system developed in the Netherlands scanned the blocks at Orchard Dale and DeMarree Fruit Farms. Two smart sprayer technologies were used to apply thinning treatments: a three-row Munckhof sprayer equipped with ON/OFF nozzle control was used at the DeMarree site and a recently developed smart sprayer with pulse-width modulation (PWM) nozzles provided by Monroe Tractor, was used at the Orchard Dale and Lamont Fruit sites.
At each location, variable-rate thinning prescriptions were developed to deliver different thinning intensities to trees classified as having high, medium, or low bloom density. A comparison conventional thinning program consisted of two blossom thinning sprays (ATS at Lamont and Orchard Dale and Lime Sulfur and oil at DeMarree) timed using the pollen tube growth model (PTGM), followed by a petal fall spray applied when fruitlets were approximately 5-6 mm in diameter, and a fourth thinning spray applied at the 10-13 mm fruitlet stage. The variable-rate spraying treatment for high blooming trees was thinned the same way as the conventional spraying treatment. The variable-rate spraying treatment for medium blooming trees was only one thinning application at the petal fall stage with a reduced dose. The low blooming trees did not receive a thinner application during the thinning season but received 2 sprays of a blossom inhibitor (Arrange = GA7) at 20 and 30 mm fruit size to help prevent a ‘snow bloom’ return bloom response next year. For the Arrange sprays, a new prescription map was developed from Outfield and AUREA imaging to target only trees with fewer than 10-35 blossom clusters per tree across all trial sites.
We monitored the thinning of the high blooming trees in real time between the petal fall and the 13mm sprays with the use of the Fruit Growth Rate Model (FGRM). Five high-blooming data trees were selected at each site for repeated fruitlet measurements. A total of three fruit size measurements were conducted during the thinning season. In addition, a final measurement was completed at all three sites on Monday June 15 to evaluate fruit set after all thinning sprays had their effects.
Partial Results and Lessons Learned
The implementation of variable-rate spraying technology was highly successful during the 2026 growing season. With the FGRM we found that at 2 of the three sites we had thinned the high blooming trees to almost exactly the target fruit number while at the third site the final fruit set was slightly above the target but quite close. In addition, evaluations of number of fruits per spur showed that on the medium blooming trees which were thinned with the variable spraying treatment had more doubles per spur than where we thinned with the conventional program. Having more doubles on the medium and low blooming trees is desirable since they did not have enough flower clusters to achieve the target fruit number with only singles per spur.
A tremendous amount of technical cooperation and support was provided by both European vision- system companies, (AUREA Imaging and Outfield). Blossom scanning data was processed rapidly, with turnaround times of only 2-3 hours, and prescription maps were delivered to growers on the same day as requested by each of the growers.
In one instance, a grower requested a customized prescription map for a small buffer zone established adjacent to the experimental plots in order to evaluate the accuracy of the smart sprayer on a few individual trees before applying the research treatment. This last-minute validation test was successfully implemented at the DeMarree site, and the results were excellent. The trial provided additional confidence in the accuracy, precision, and reliability of the variable-rate spraying system under commercial orchard operations.
A particularly important outcome of this project was the close collaboration that developed between local fruit growers and Monroe Tractor, where MT implemented innovative agricultural technology was on a sprayer. During the winter of 2026, Monroe Tractor worked closely with Orchard Dale Fruit Farms and Lamont Fruit Farms to develop a versatile ‘smart sprayer’ prototype. The system combined a conventional airblast sprayer with pulse-width modulation (PWM) nozzles and the computing capability necessary to read and execute prescription maps generated by both OUTFIELD and AUREA Imaging. To our knowledge, this represents a unique strategic partnership in which a local company collaborated directly with commercial fruit growers to develop and adapt cutting-edge precision spraying technology specifically for New York orchards. This effort has the potential to make variable-rate chemical applications more practical and affordable for fruit growers, thereby accelerating the adoption of precision crop load management technologies throughout the New York apple industry.
With technical support from Dr. Yu Jiang of Cornell AgriTech and his research technician, Ryan Weber, we implemented GPS-RTK mapping of the four corners of each variable-rate and conventional spraying plots at all trial locations. This significantly improved the spatial accuracy of treatment applications by ensuring precise alignment between the prescription maps and the smart sprayers. The successful integration of GPS-RTK technology demonstrated that variable-rate spraying can be effectively implemented across a range of high-density orchard systems and training architectures. Furthermore, the technology showed strong potential for helping growers achieve more uniform orchard blocks by managing crop load variability and targeting specific yield objectives tailored to individual cultivar-rootstock combinations. This level of precision could ultimately improve fruit size consistency, return bloom potential, and overall orchard profitability.
Growers participating in these variable-rate spraying trials were required to pay much closer attention to the number and distribution of blossom clusters per tree than they typically would under conventional thinning programs. Throughout the duration of the experiment, cooperating growers carefully evaluated crop load variability within the experimental plot and monitored fruit set distribution in the upper, middle, and lower portions of the canopy. This resulted in adjustments in real time of thinning strategies. Initially, growers requested and utilized the same prescription maps for both the blossom thinning and petal fall spray applications. However, as the season progressed and thinning efficacy became more apparent, it became necessary to refine the thinning management strategy. All cooperating growers ultimately requested a second set of prescriptions maps for the 13mm spray to specifically target trees with the highest bloom densities and crop load potential.
An important lesson learned from these trials was that prescription maps should be viewed as dynamic management tools rather than static recommendations. As orchard conditions and crop load estimates changed throughout the thinning season, growers benefited from updating prescription maps to reflect the evolving needs of the blocks. This adaptive approach improved crop load management and helped achieve more uniform thinning responses across highly variable orchard sites.
Notably, none of the cooperating growers required a rescue thinning spray to achieve their desired crop load targets. This outcome suggests that variable-rate thinning applications, when combined with timely field observations and updated prescription maps, can provide growers with a high degree of precision and confidence in managing crop load variability while reducing the need for corrective thinning interventions later in the season, and much less hand thinning in July.
After this variable-rate thinning experiment, we can clearly see the potential for other variable-rate applications aimed at bud load management during the winter months or early spring. In the near future, growers will be able to provide crew leaders and orchard workers with prescription maps on their smart phones as they move through orchard rows and perform more precise manual pruning tasks. Workers will be able to prune high, medium, or low bud load trees to the optimum target bud number by simply viewing their spatial location on a prescription map, identifying whether they are in a high-, medium-, or low-bud canopy zone, and adjusting their pruning severity accordingly.
In the coming years, we also envision variable-rate bud load management being implemented through fully integrated pruning machines. Growers will scan their orchard and then receive a prescription map that can be uploaded into a computer system capable of controlling the machine’s hydraulic functions. The hydraulic system will then automatically adjust the pruning machine according to the prescribed bud load targets. Therefore, future implementation of variable-rate bud load management could be achieved through either human labor or automated machinery, or a hybridization of both approaches, allowing for more precise pruning throughout the orchard.
Next Steps:
The harvest evaluation of variable-rate thinning compared with conventional spraying is perhaps the most important final step for growers interested in adopting this technology. Conducting this type of evaluation can be challenging during a busy harvest season. Although growers may rely on visual observations or their own experience to assess outcomes, it is important to accurately quantify both yield and fruit quality to determine whether the technology successfully improved orchard uniformity. Ultimately, growers should evaluate the economic impact of their crop load management efforts and determine whether variable-rate thinning generated sufficient returns to justify the investment.
We plan to count the final number of fruits per tree before any hand thinning is performed at the research sites in order to evaluate the predictive power of the Fruit Growth Rate Model (FGRM). In addition, we will measure and compare the hand-thinning time required in the variable-rate and conventional thinning plots at all sites. This data will be incorporated into the economic analysis of the technology.
Finally, we will evaluate the overall impact of variable-rate thinning versus conventional thinning by harvesting the research plots separately and assessing fruit quality and packout performance in commercial packinghouses. Fruit from the Orchard Dale and Lamont research plots will be stored and evaluated separately by Lake Ontario Fruit Company in Orleans, New York. Fruit from the DeMarree research plot will be evaluated by Rice Fruit Company in Pennsylvania.